GC Pauses and Safe Points
08 Aug 2016 - 1669 wordsGC pauses are a popular topic, if you do a google search, you’ll see lots of articles explaining how to measure and more importantly how to reduce them. This issue is that in most runtimes that have a GC, allocating objects is a quick operation, but at some point in time the GC will need to clean up all the garbage and to do this is has to pause the entire runtime (except if you happen to be using Azul’s pauseless GC for Java).
The GC needs to pause the entire runtime so that it can move around objects as part of it’s compaction phase. If these objects were being referenced by code that was simultaneously executing then all sorts of bad things would happen. So the GC can only make these changes when it knows that no other code is running, hence the need to pause the entire runtime.
GC Flow
In a previous post I demonstrated how you can use ETW Events to visualise what the .NET Garbage Collector (GC) is doing. That post included the following GC flow for a Foreground/Blocking Collection (info taken from the excellent blog post by Maoni Stephens the main developer on the .NET GC):
GCSuspendEE_V1GCSuspendEEEnd_V1<– suspension is doneGCStart_V1GCEnd_V1<– actual GC is doneGCRestartEEBegin_V1GCRestartEEEnd_V1<– resumption is done.
This post is going to be looking at how the .NET Runtime brings all the threads in an application to a safe-point so that the GC can do it’s work. This corresponds to what happens between step 1) GCSuspendEE_V1 and 2) GCSuspendEEEnd_V1 in the flow above.
For some background this passage from the excellent Pro .NET Performance: Optimize Your C# Applications explains what’s going on:
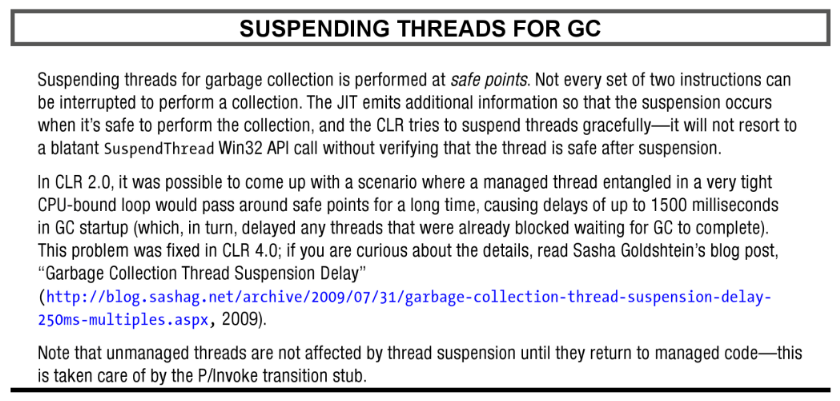
Technically the GC itself doesn’t actually perform a suspension, it calls into the Execution Engine (EE) and asks that to suspend all the running threads. This suspension needs to be as quick as possible, because the time taken contributes to the overall GC pause. Therefore this Time To Safe Point (TTSP) as it’s known, needs to be minimised, the CLR does this by using several techniques.
GC suspension in Runtime code
Inside code that it controls, the runtime inserts method calls to ensure that threads can regularly poll to determine when they need to suspend. For instance take a look at the following code snippet from the IndexOfCharArray() method (which is called internally by String.IndexOfAny(..)). Notice that it contains multiple calls to the macro FC_GC_POLL_RET():
FCIMPL4(INT32, COMString::IndexOfCharArray, StringObject* thisRef, CHARArray* valueRef, INT32 startIndex, INT32 count)
{
    // <OTHER CODE REMOVED>

    // use probabilistic map, see (code:InitializeProbabilisticMap)
    int charMap[PROBABILISTICMAP_SIZE] = {0};

    InitializeProbabilisticMap(charMap, valueChars, valueLength);

    for (int i = startIndex; i < endIndex; i++) {
        WCHAR thisChar = thisChars[i];
        if (ProbablyContains(charMap, thisChar))
            if (ArrayContains(thisChars[i], valueChars, valueLength) >= 0) {
                FC_GC_POLL_RET();
                return i;
            }
    }

    FC_GC_POLL_RET();
    return -1;
}
The are lots of other places in the runtime where these calls are inserted, to ensure that a GC suspension can happen as soon as possible. However having these calls spread throughout the code has an overhead, so the runtime uses a special trick to ensure the cost is only paid when a suspension has actually been requested, From jithelp.asm you can see that the method call is re-written to a nop routine when not needed and only calls the actual JIT_PollGC() function when absolutely required:
; Normally (when we're not trying to suspend for GC), the
; CORINFO_HELP_POLL_GC helper points to this nop routine.  When we're
; ready to suspend for GC, we whack the Jit Helper table entry to point
; to the real helper. When we're done with GC we whack it back.
PUBLIC @JIT_PollGC_Nop@0
@JIT_PollGC_Nop@0 PROC
ret
@JIT_PollGC_Nop@0 ENDP
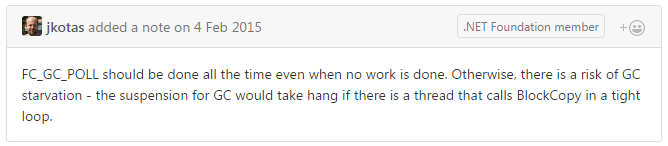
However calls to FC_GC_POLL need to be carefully inserted in the correct locations, too few and the EE won’t be able to suspend quickly enough and this will cause excessive GC pauses, as this comment from one of the .NET JIT devs confirms:
GC suspension in User code
Alternatively, in code that the runtime doesn’t control things are a bit different. Here the JIT analyses the code and classifies it as either:
- Partially interruptible
- Fully interruptible
Partially interruptible code can only be suspended at explicit GC poll locations (i.e. FC_GC_POLL calls) or when it calls into other methods. On the other hand fully interruptible code can be interrupted or suspended at any time, as every line within the method is considered a GC safe-point.
I’m not going to talk about how the thread-hijacking mechanism works (used with fully interruptible code), as it’s a complex topic, but as always there’s an in-depth section in the BOTR that gives all the gory details. If you don’t want to read the whole thing, in summary it suspends the underlying native thread, via the Win32 SuspendThread API.
You can see some of the heuristics that the JIT uses to decide whether code is fully or partially interruptible as it seeks to find the best trade-off between code quality/size and GC suspension latency. But as a concrete example, if we take the following code that accumulates a counter in a tight loop:
public static long TestMethod()
{
    long counter = 0;
    for (int i = 0; i < 1000 * 1000; i++)
    {
        for (int j = 0; j < 2000; j++)
        {
            if (i % 10 == 0)
                counter++;
        }
    }
    Console.WriteLine("Loop exited, counter = {0:N0}", counter);
    return counter;
}
And then execute it with the JIT diagnostics turned on you get the following output, which shows that this code is classified as fully interruptible:
; Assembly listing for method ConsoleApplication.Program:TestMethod():long
; Emitting BLENDED_CODE for X64 CPU with AVX
; optimized code
; rsp based frame
; fully interruptible
(full JIT diagnostic output of Fully Interruptible method)
Now, if we run the same test again, but tweak the code by adding a few Console.WriteLine(..) methods calls:
public static long TestMethod()
{
    long counter = 0;
    for (int i = 0; i < 1000 * 1000; i++)
    {
        for (int j = 0; j < 2000; j++)
        {
            if (i % 10 == 0)
                counter++;
            Console.WriteLine("Inside Inner Loop, counter = {0:N0}", counter);
        }
        Console.WriteLine("After Inner Loop, counter = {0:N0}", counter);
    }
    Console.WriteLine("Thread loop exited cleanly, counter = {0:N0}", counter);
    return counter;
}
The method is then classified as Partially Interruptible, due to the additional Console.WriteLine(..) calls:
; Assembly listing for method ConsoleApplication.Program:TestMethod():long
; Emitting BLENDED_CODE for X64 CPU with AVX
; optimized code
; rsp based frame
; partially interruptible
(full JIT diagnostic output of Partially Interruptible method)
Interesting enough there seems to be functionality that enables JIT_PollGC() calls to be inserted into user code as they are compiled by the .NET JIT, this is controlled by the GCPollType CLR Configuration flag. However by default it’s disabled and in my tests turning it on causes the CoreCLR to exit with some interesting errors. So it appears that currently, the default or supported behaviour is to use thread-hijacking on user code, rather than inserting explicit JIT_PollGC() calls.
Further Reading
- Modern Garbage Collection in Theory and Practice
- GC-safe points, mutator suspension and barriers
- How local variable usage infomation is maintained in .net clr source code
- Thread.Suspend, Garbage Collection, and Safe Points
- LLVM as a code generator for the CoreCLR - With a particular emphasis on GC
- Comments on “SuspendRuntime” and “Redirection vs. Hijacking:” in
threadsuspend.cpp - Comments on “Suspending The Runtime”, “Cooperative Mode” and “Partially/Fully Interuptible Code” in
threads.h - What Every Developer Must Know About Fast Garbage Collection (+ more)
- Does the .NET Garbage Collector’s stop-the-world effect halt or delay the execution of unmanaged threads and timer callbacks?
- GC Behavior and CLR Thread Hijacking
- Safely pausing of thread during GC in .NET
- CLR and Thread Safe Points
- Suspending and resuming threads for GC