Adventures in Benchmarking - Performance Golf
16 May 2016 - 1010 wordsRecently Nick Craver one of the developers at Stack Overflow has been tweeting snippets of code from their source, the other week the following code was posted:
A daily screenshot from the Stack Overflow codebase (checking strings for tokens without allocations). #StackCode pic.twitter.com/sDPqviHgD0
— Nick Craver (@Nick_Craver) April 20, 2016
This code is an optimised version of what you would normally write, specifically written to ensure that is doesn’t allocate memory. Previously Stack Overflow have encountered issues with large pauses caused by the .NET GC, so it appears that where appropriate, they make a concerted effort to write code that doesn’t needlessly allocate.
I also have to give Nick credit for making me aware of the term “Performance Golf”, I’ve heard of Code Golf, but not the Performance version.
Aside: If you want to see the full discussion and the code for all the different entries, take a look at this gist. Also for a really in-depth explanation of what the fastest version is actually doing, I really recommend checking out Kevin Montrose’s blog post “An Optimisation Exercise”, there’s some very cool tricks in there, although by this point he is basically writing C/C++ code rather than anything you would recognise as C#!
Good Benchmarking Tools
In this post I’m not going to concentrate too much on this particular benchmark, but instead I’m going to use it as an example of what I believe a good benchmarking library should provide for you. Full disclaimer, I’m one of the authors of BenchmarkDotNet, so I admit I might be biased!
I think that a good benchmarking tool should offer the following features:
Benchmark Scaffolding
By using BenchmarkDotNet, or indeed any benchmarking tool, you can just get on with the business of actually writing the benchmark and not worry about any of the mechanics of accurately measuring the code. This is important because often when someone has posted an optimisation and accompanying benchmark on Stack Overflow, several of the comments then point out why their measurements are inaccurate or plain wrong.
In the case of BenchmarkDotNet, it’s as simple as adding a [Benchmark] attribute to the methods that you want to benchmark and then a few lines of code to launch the run:
[Benchmark(Baseline = true)]
public bool StringSplit()
{
    var tokens = Value.Split(delimeter);
    foreach (var token in tokens)
    {
        if (token == Match)
            return true;
    }
    return false;
}

static void Main(string[] args)
{
    var summary = BenchmarkRunner.Run<Program>();
}
It also offers a few more tools for advanced scenarios, for instance you can decorate a field/property with the [Params] attribute like so:
[Params("Foo;Bar",
        "Foo;FooBar;Whatever",
        "Bar;blaat;foo",
        "blaat;foo;Bar",
        "foo;Bar;Blaat",
        "foo;FooBar;Blaat",
        "Bar1;Bar2;Bar3;Bar4;Bar",
        "Bar1;Bar2;Bar3;Bar4;NoMatch",
        "Foo;FooBar;Whatever",
        "Some;Other;Really;Interesting;Tokens")]
public string Value { get; set; }
and then each benchmark will be run multiples times, with Value set to the different strings. This gives you a really easy way of trying out benchmarks across different inputs. For instance some methods were consistently fast, whereas other performed badly on inputs that were a worse-case scenario for them.
Diagnose what is going on
If you state that the aim of optimising you code is to “check a string for tokens, without allocations”, you would really like to be able to prove if that is true or not. I’ve previously written about how BenchmarkDotNet can give you this information and in this case we get the following results (click for full-size image):
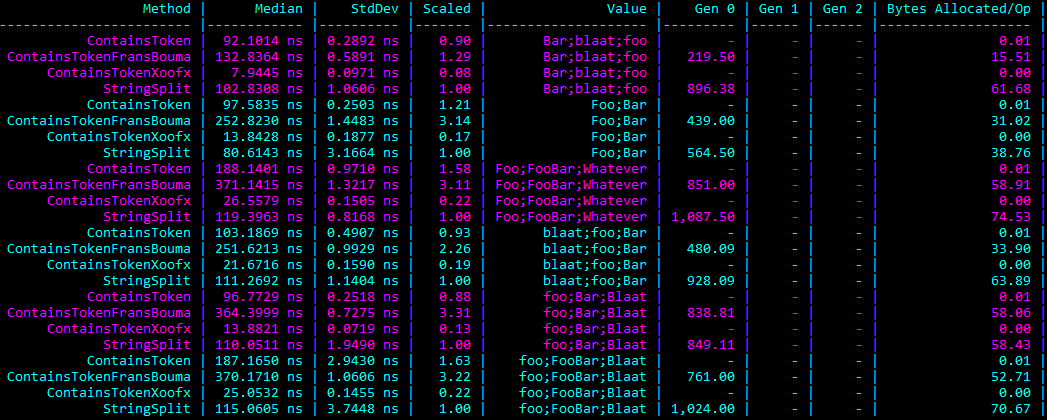
So you can see that the ContainTokenFransBouma benchmark isn’t allocation free, which in the scenario is a problem.
Consistent, Reliable and Clear Results
Another important aspect is that you should be able to rely on the results. Part of this is trusting the tool and hopefully people will come to trust BenchmarkDotNet over time.
Also you should be able to get clear results, so in as well as providing a text-based result table that you can easily paste into a GitHub issue or Stack Overflow answer, BenchmarkDotNet will provide several graphs using the R statistics and graphing library. Sometimes a wall of text isn’t the easiest thing to interpret, but colourful graphs can help (click for full image).
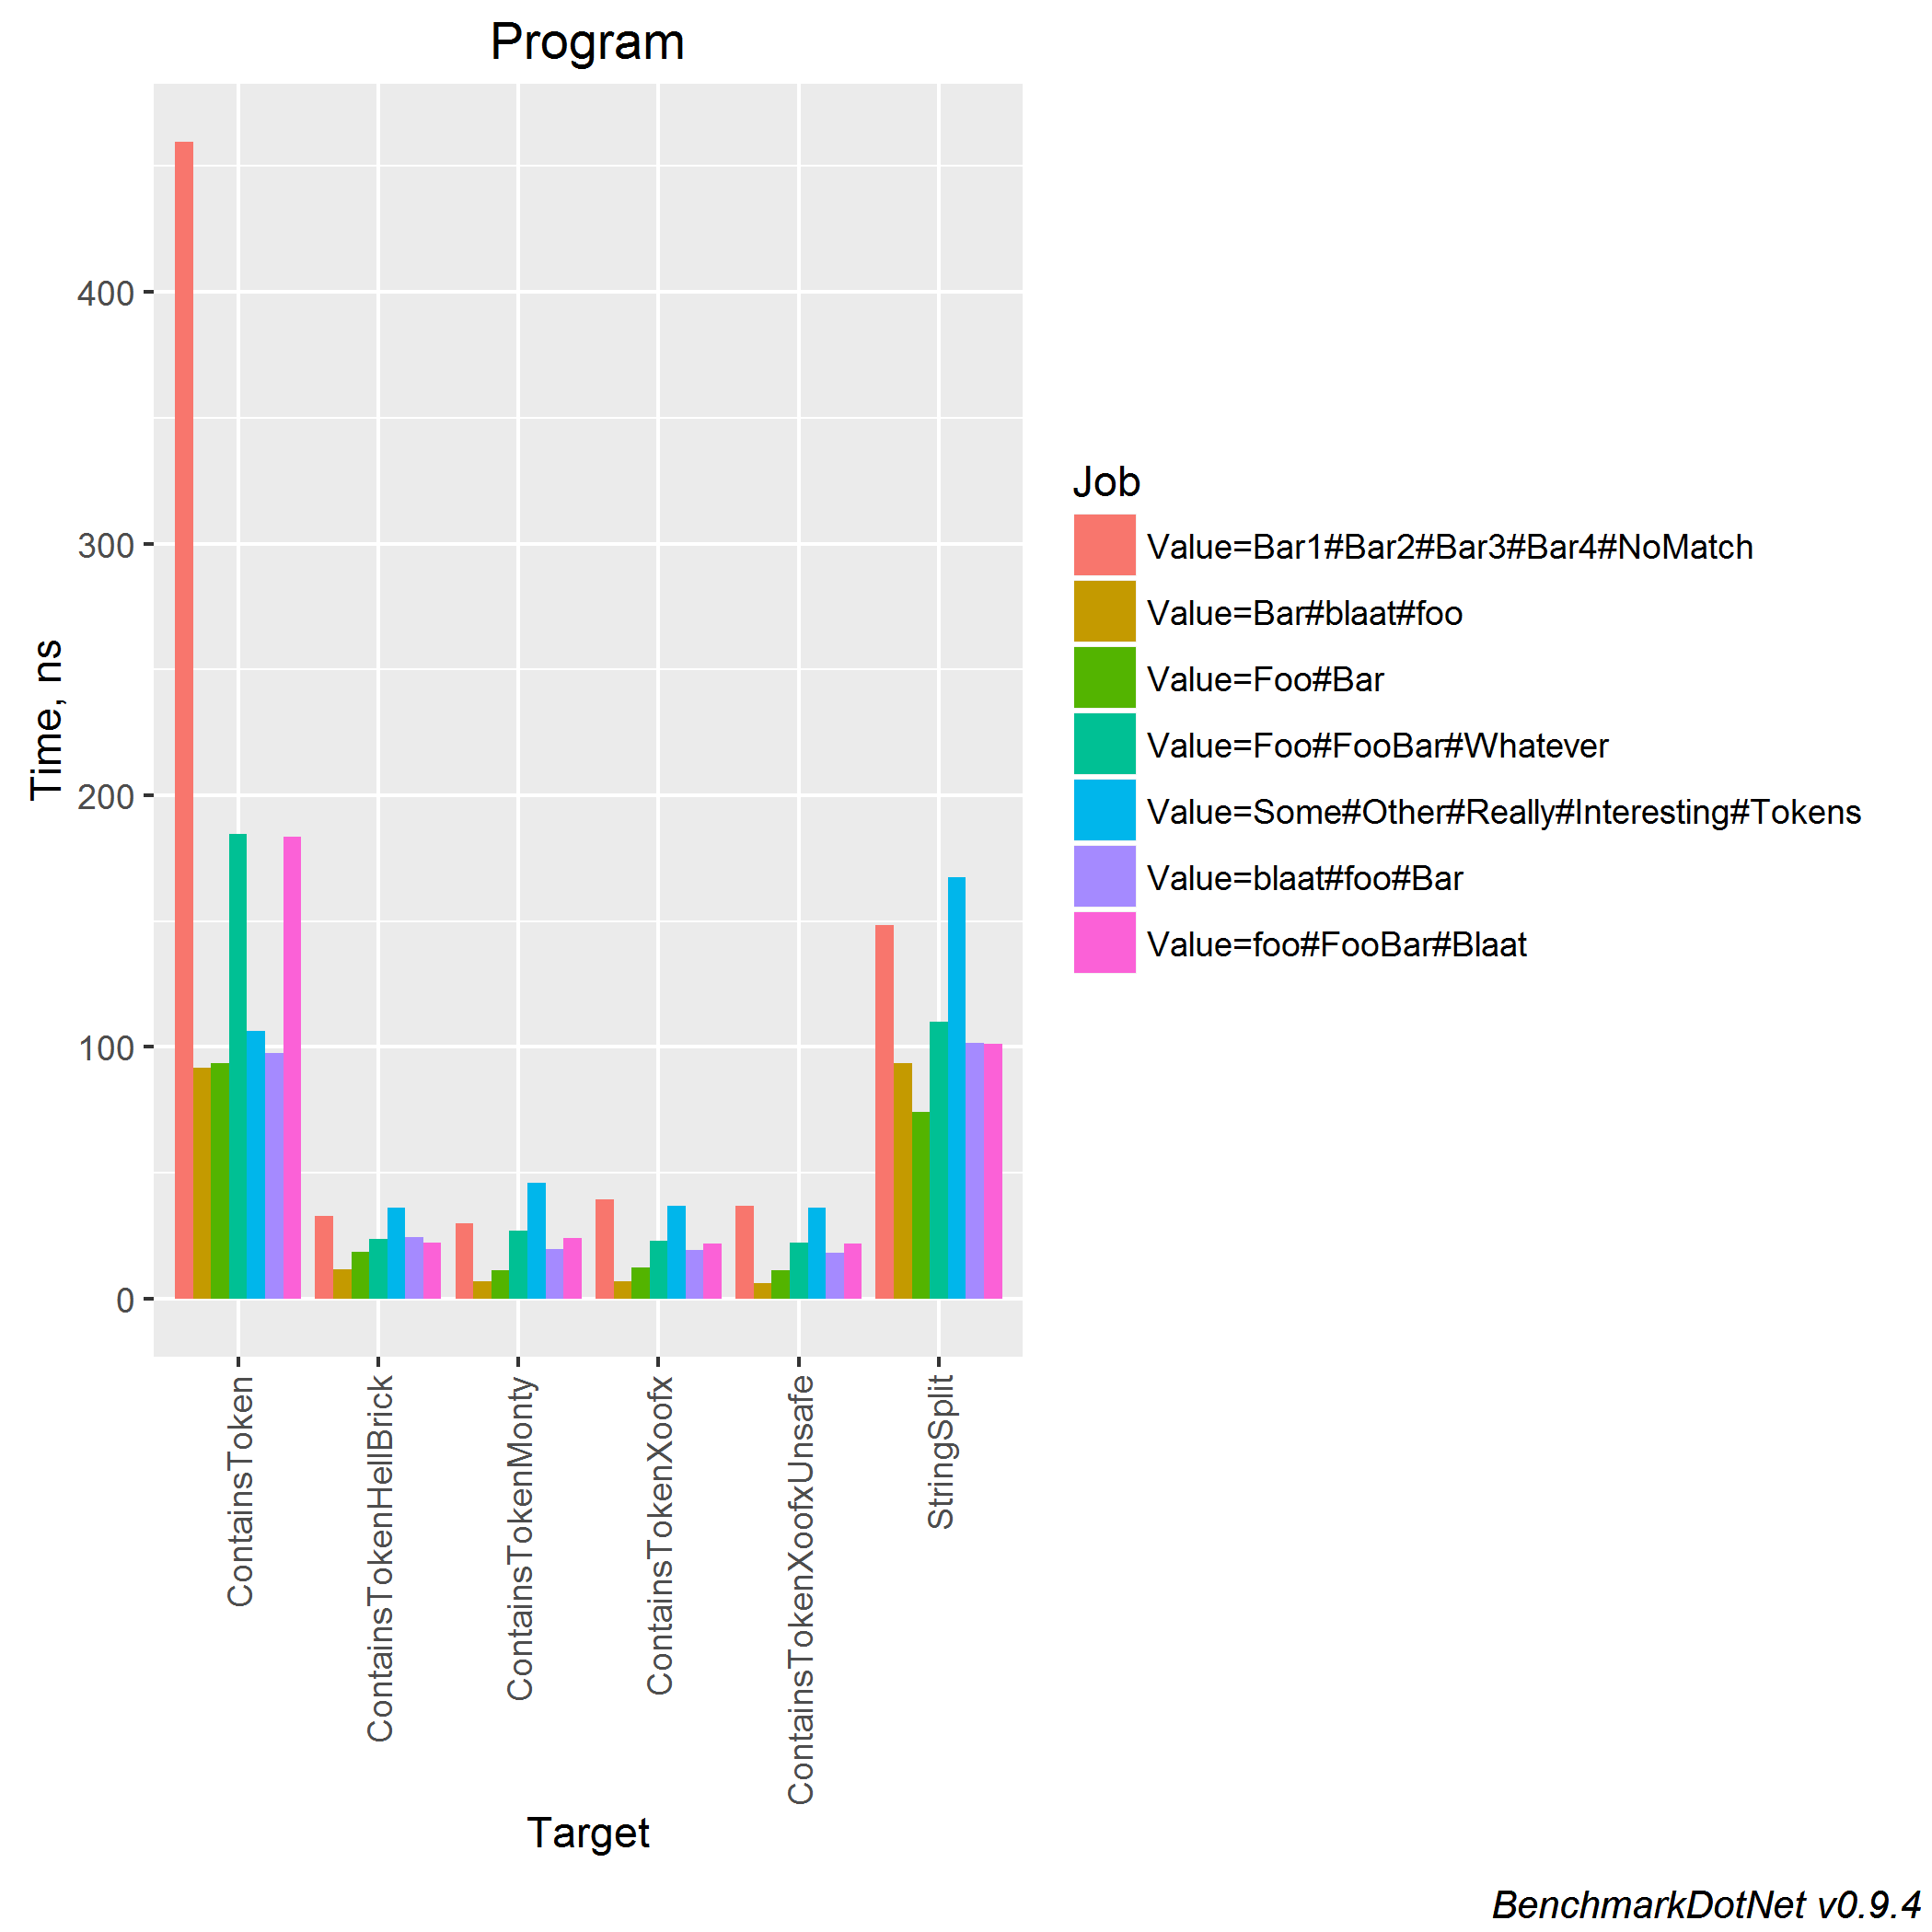
Here we can see that the original ContainsToken code is “slower” in some scenarios (although it’s worth pointing out that the Y-axis is in nanoseconds).
Summary
Would I recommend writing code like any of these optimisations for normal day-to-day scenarios? No.
Without exception the optimised versions of the code are less readable, harder to debug and probably contain more errors. Certainly, by the time you get to the fastest version you are no longer writing recognisable C# code, it’s basically C++/C masquerading as C#.
However, for the purposes of learning, a bit of fun or just because you like a spot of competition, then it’s fine. Just make sure you use a decent tool that lets you get on with the fun part of writing the most optimised code possible!